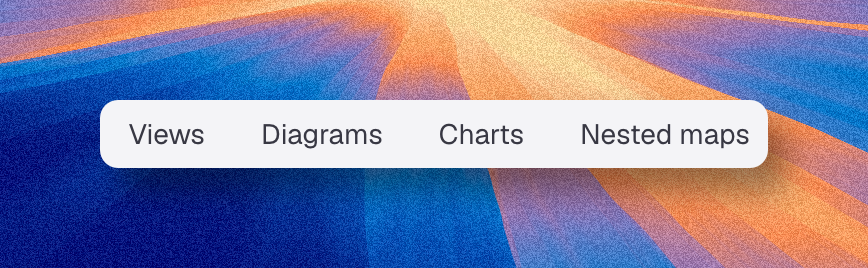
Visualizations and spaces
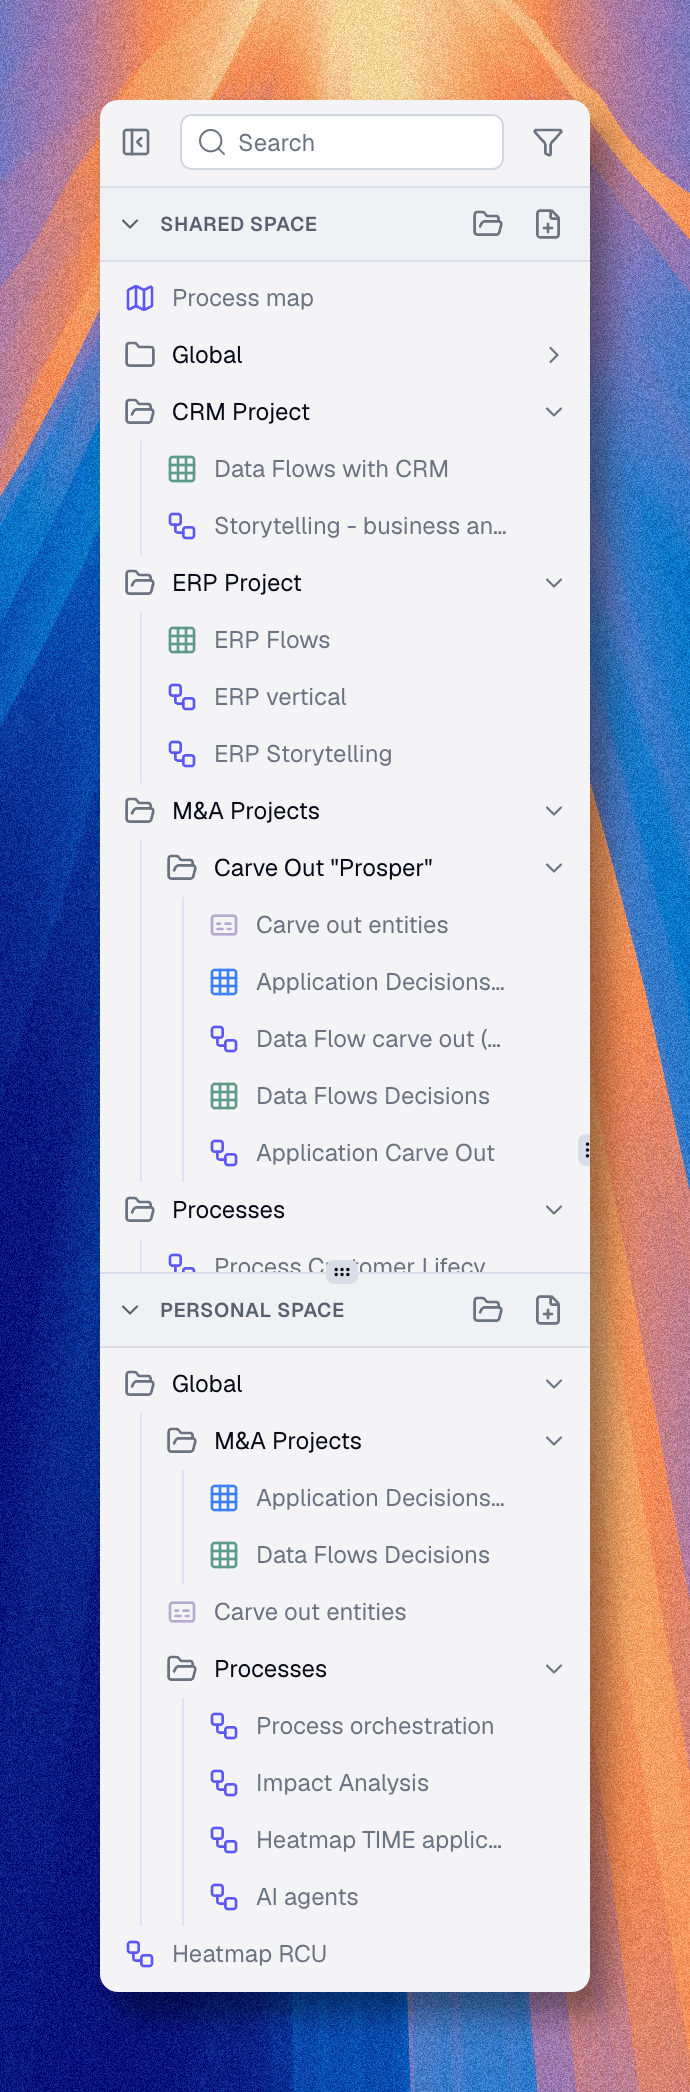
Visualizations are different ways to read the same knowledge base. They do not replace the inventory. They read it from a specific angle for exploration, analysis, presentation, or collaboration. When saved, these visualizations appear in the catalog, which is split between the shared organization space and each user's personal space.
Creation and saving
These visualizations do not all follow the same creation and saving pattern.
- A view can be configured first by filtering, grouping, sorting, or changing the layout. It only becomes a saved view when you choose Save view as. After that, you can update the same saved view with Save view.
- A diagram is created first, then edited. Once the diagram exists, you work directly inside it, and the diagram content is synchronized as you edit rather than through a separate save step in the standard toolbar.
- A chart is created first from the catalog or a creation dialog. You give it a name, Boldo creates it, and then you configure it. Once it exists, you update it with Save chart. Save chart as is useful when you want to keep the current configuration as a separate chart.
- A nested map is created first from the catalog or a creation dialog. You give it a name, Boldo creates it, and then you configure it. Once it exists, you update it with Save nested map. Save nested map as lets you keep the current configuration as a separate nested map.
- A process flow is part of an asset. It is not saved in the catalog, and its changes are synchronized as you edit the asset flow.
- A dashboard is created first from the catalog or a creation dialog. You give it a name, Boldo creates it, and then you compose it by adding widgets. You commit your changes with Save, or keep a copy of the current state as a new dashboard with Save as.
View
A view is a filtered and structured representation of your assets. Use it when you need a working subset of the inventory.
In practice, a view is a filter of the inventory that you can save and reuse. It is where you filter, group, sort, and review part of the inventory. This lets you create focused subsets of assets that matter for one use case, one team, or one question, and come back to them directly instead of searching the whole inventory again. The same view can be displayed as a table, cards, or a pivot matrix depending on the type of reading you need.
Diagram
A diagram is a collaborative canvas where you can explain or workshop specific portions of your architecture.
It is useful when you need to arrange assets spatially, add shapes or text, and communicate a specific story or workshop outcome while keeping the asset relationships connected to the inventory.
It can also be a practical starting point for modeling. In a diagram, you can begin with draft assets, name them, connect them, and only then add them to the inventory once the structure is clear. In some cases, this is easier than creating each asset one by one in inventories and linking them afterward through relationship fields.
Chart
A chart transforms inventory data into indicators and comparisons. Use it when you want to compare values, distributions, or counts instead of reading assets one by one.
For example, a chart can help you see how many applications are in each status, compare assets by criticality, or break down your inventory by owner, domain, or another important dimension.
Nested map
A nested map dynamically computes hierarchies based on relationship paths.
Its main use case is capability mapping, but it is more flexible than that.
Use it when you want to display assets and their connected assets as blocks and sub-blocks computed from the knowledge base instead of drawing that hierarchy manually.
For example, you can use a nested map to show which applications belong to which server, which capabilities are supported by which applications, or who is responsible for what across a structured hierarchy.
Process flow
A process flow models step-by-step workflows, lifecycles, or pipelines within an asset.
Use it when you want to describe a sequence of actions, decisions, and outcomes connected to a specific asset. Process flows support real-time collaboration and are available on asset types where an administrator has enabled the Flow option.
Dashboard
A dashboard is a composite page that gathers several visualizations on a single grid.
Use it when one reading angle is not enough. A dashboard mixes charts, views, diagrams, nested maps, single assets, and rich-text blocks in resizable widgets. It does not hold new data of its own: every widget reads from an item you already have in the catalog, or from an asset in the inventory.
Dashboards are useful for executive overviews, domain reviews, and reporting pages that assemble existing content around a question.
Private and shared spaces
Visualizations can live in your private personal space or in the shared organization space. This is what lets you keep drafts private, prepare work before publishing it, or move a visualization into the shared context of the organization when it is ready.
The inventory does not work that way. Assets do not live in a private space or a shared space. The inventory is always shared knowledge inside the organization.
This matters especially in diagrams. A draft asset can remain only in the diagram while you are exploring or sketching, and the diagram itself can stay in your personal space. As soon as you choose Add to inventory, that asset stops being only a private diagram element and becomes a normal asset in the shared inventory.
Shared does not always mean visible to everyone in the same way. Visibility can still depend on your user type, your roles, your access domains, and the plan features enabled in the organization.
Read Move and Copy Items for the practical move and copy behavior between spaces.