Diagrams
The diagram editor turns part of the inventory into a visual workspace.
Use a diagram when you want to:
- explain relationships visually
- build a workshop support
- create a shared architecture map
- enrich a visual story with shapes, text, groups, or lanes
A diagram complements the inventory. It is one way to read and communicate the knowledge already stored there.
Access
You can open a saved diagram in two main ways:
- from the catalog, if you already know which diagram you want
- from Diagrams in the navigation, if you want to browse or search the list of saved diagrams first
Create a diagram
You can create a diagram in two main ways:
Create an empty diagram
- Open Diagrams
- Click Create a diagram
- Enter a name
- Choose a folder if needed
- Validate
The diagram opens with an empty canvas.
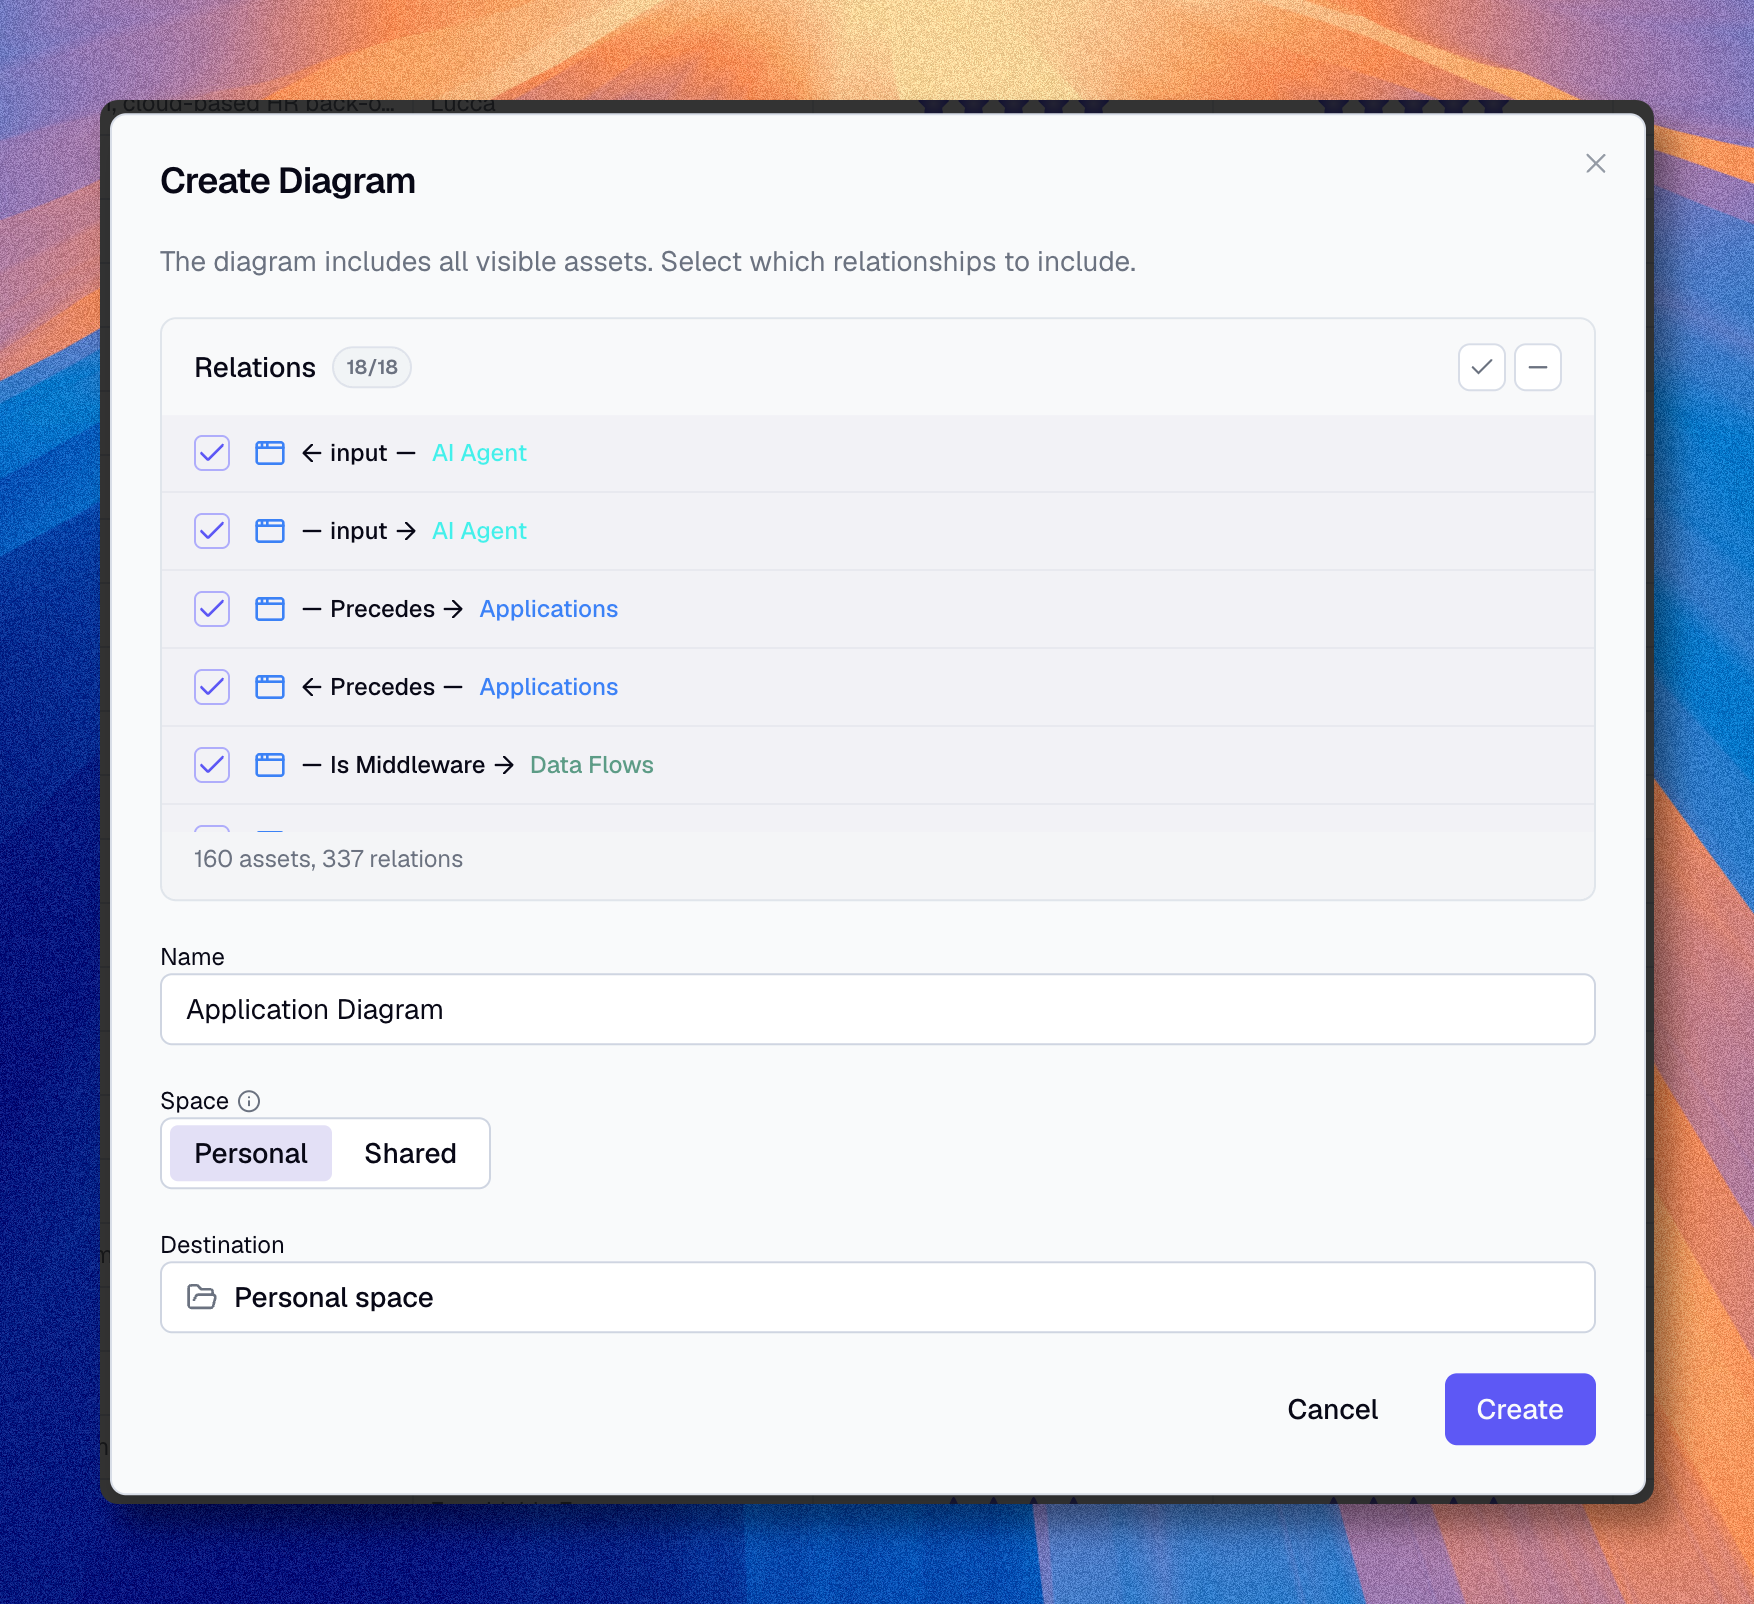
Generate a first diagram from inventory data
If you already have the right scope in an inventory or a saved view:
- Open the inventory or view
- Apply the filters you need
- Click the Convert view to diagram icon in the toolbar
A dialog opens where you name the diagram, choose which relationship types to include, and see how many assets and relationships will be included in the diagram. Confirm to create. You can then continue editing it like any other diagram.
Editor interface
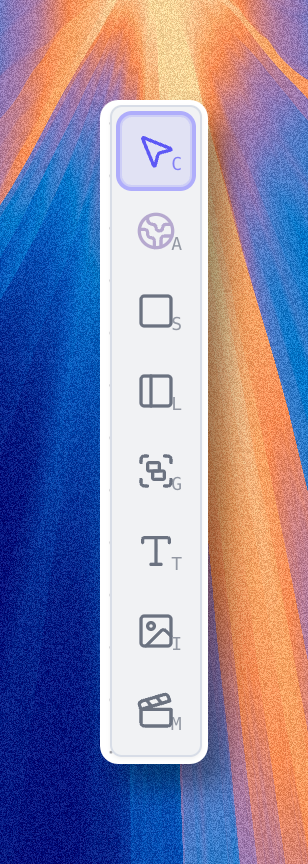
Toolbar
The toolbar gives you the main building blocks of the diagram:
| Tool | Usage |
|---|---|
| Cursor | Select and move elements |
| Assets | Add assets from the inventory |
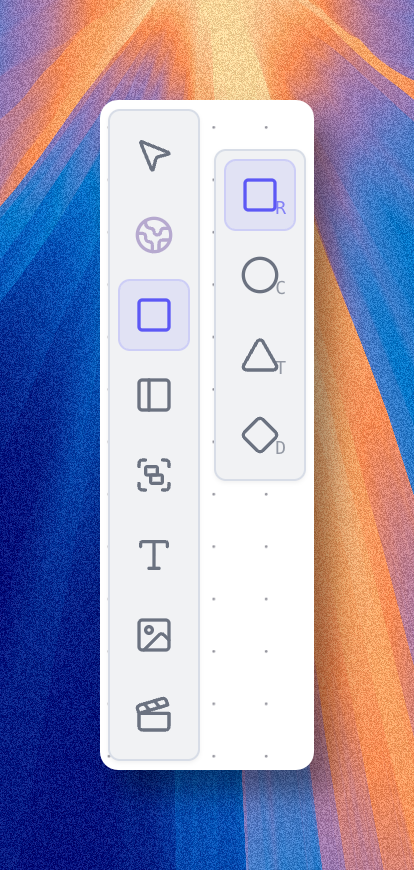
| Shapes | Add rectangles, circles, triangles, or diamonds |
| Text | Add labels, notes, or titles |
| Images | Insert images |
| Lanes | Create visual swimlanes |
| Groups | Frame and organize elements |
| Cameras | Save viewpoints for quick navigation |
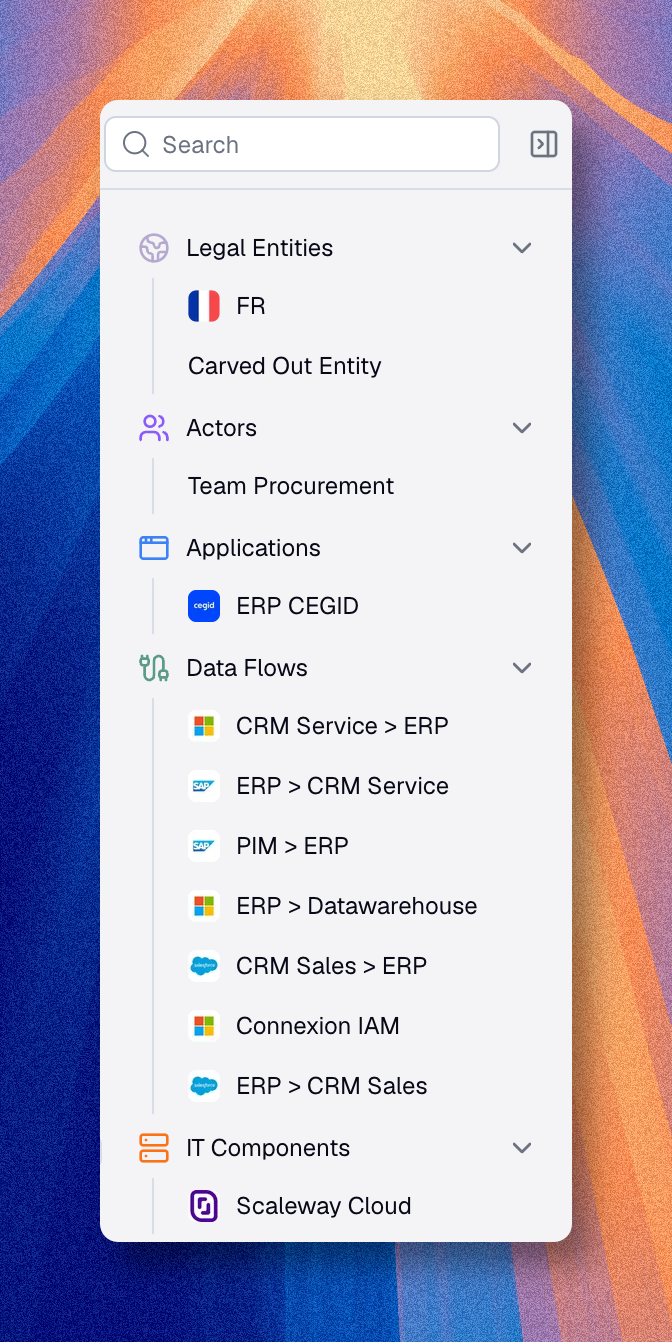
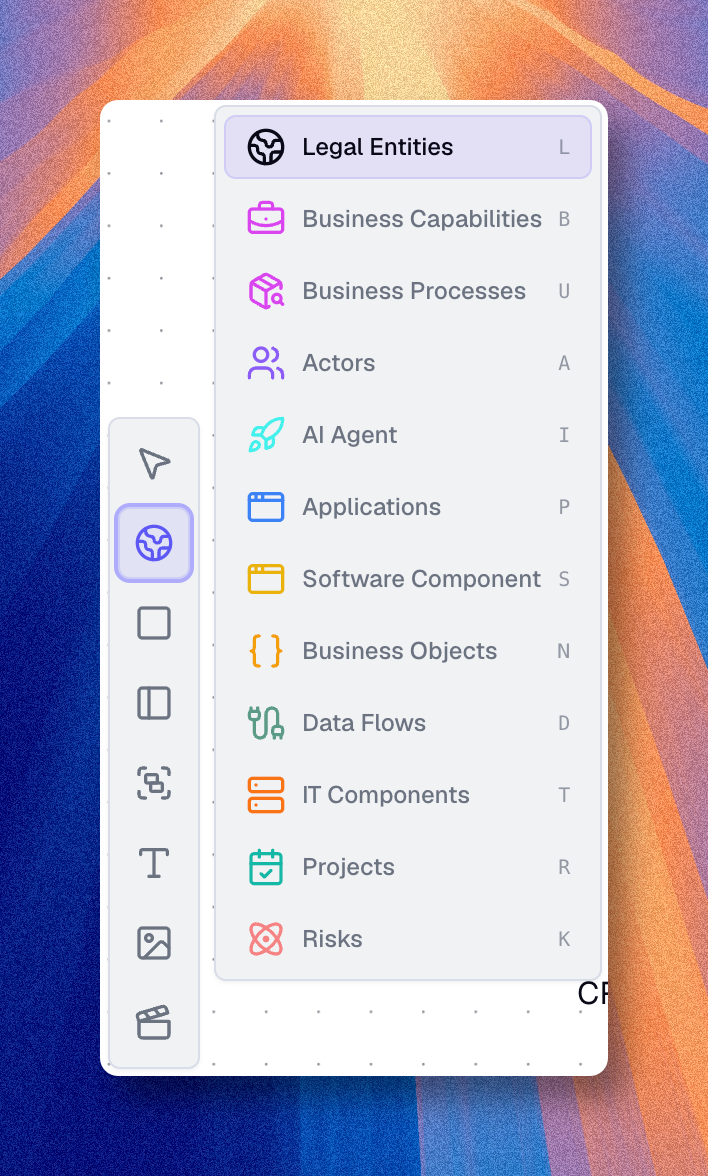
Add assets
From the palette
- Click the Assets tool
- Select an asset type
- Drag an asset onto the canvas
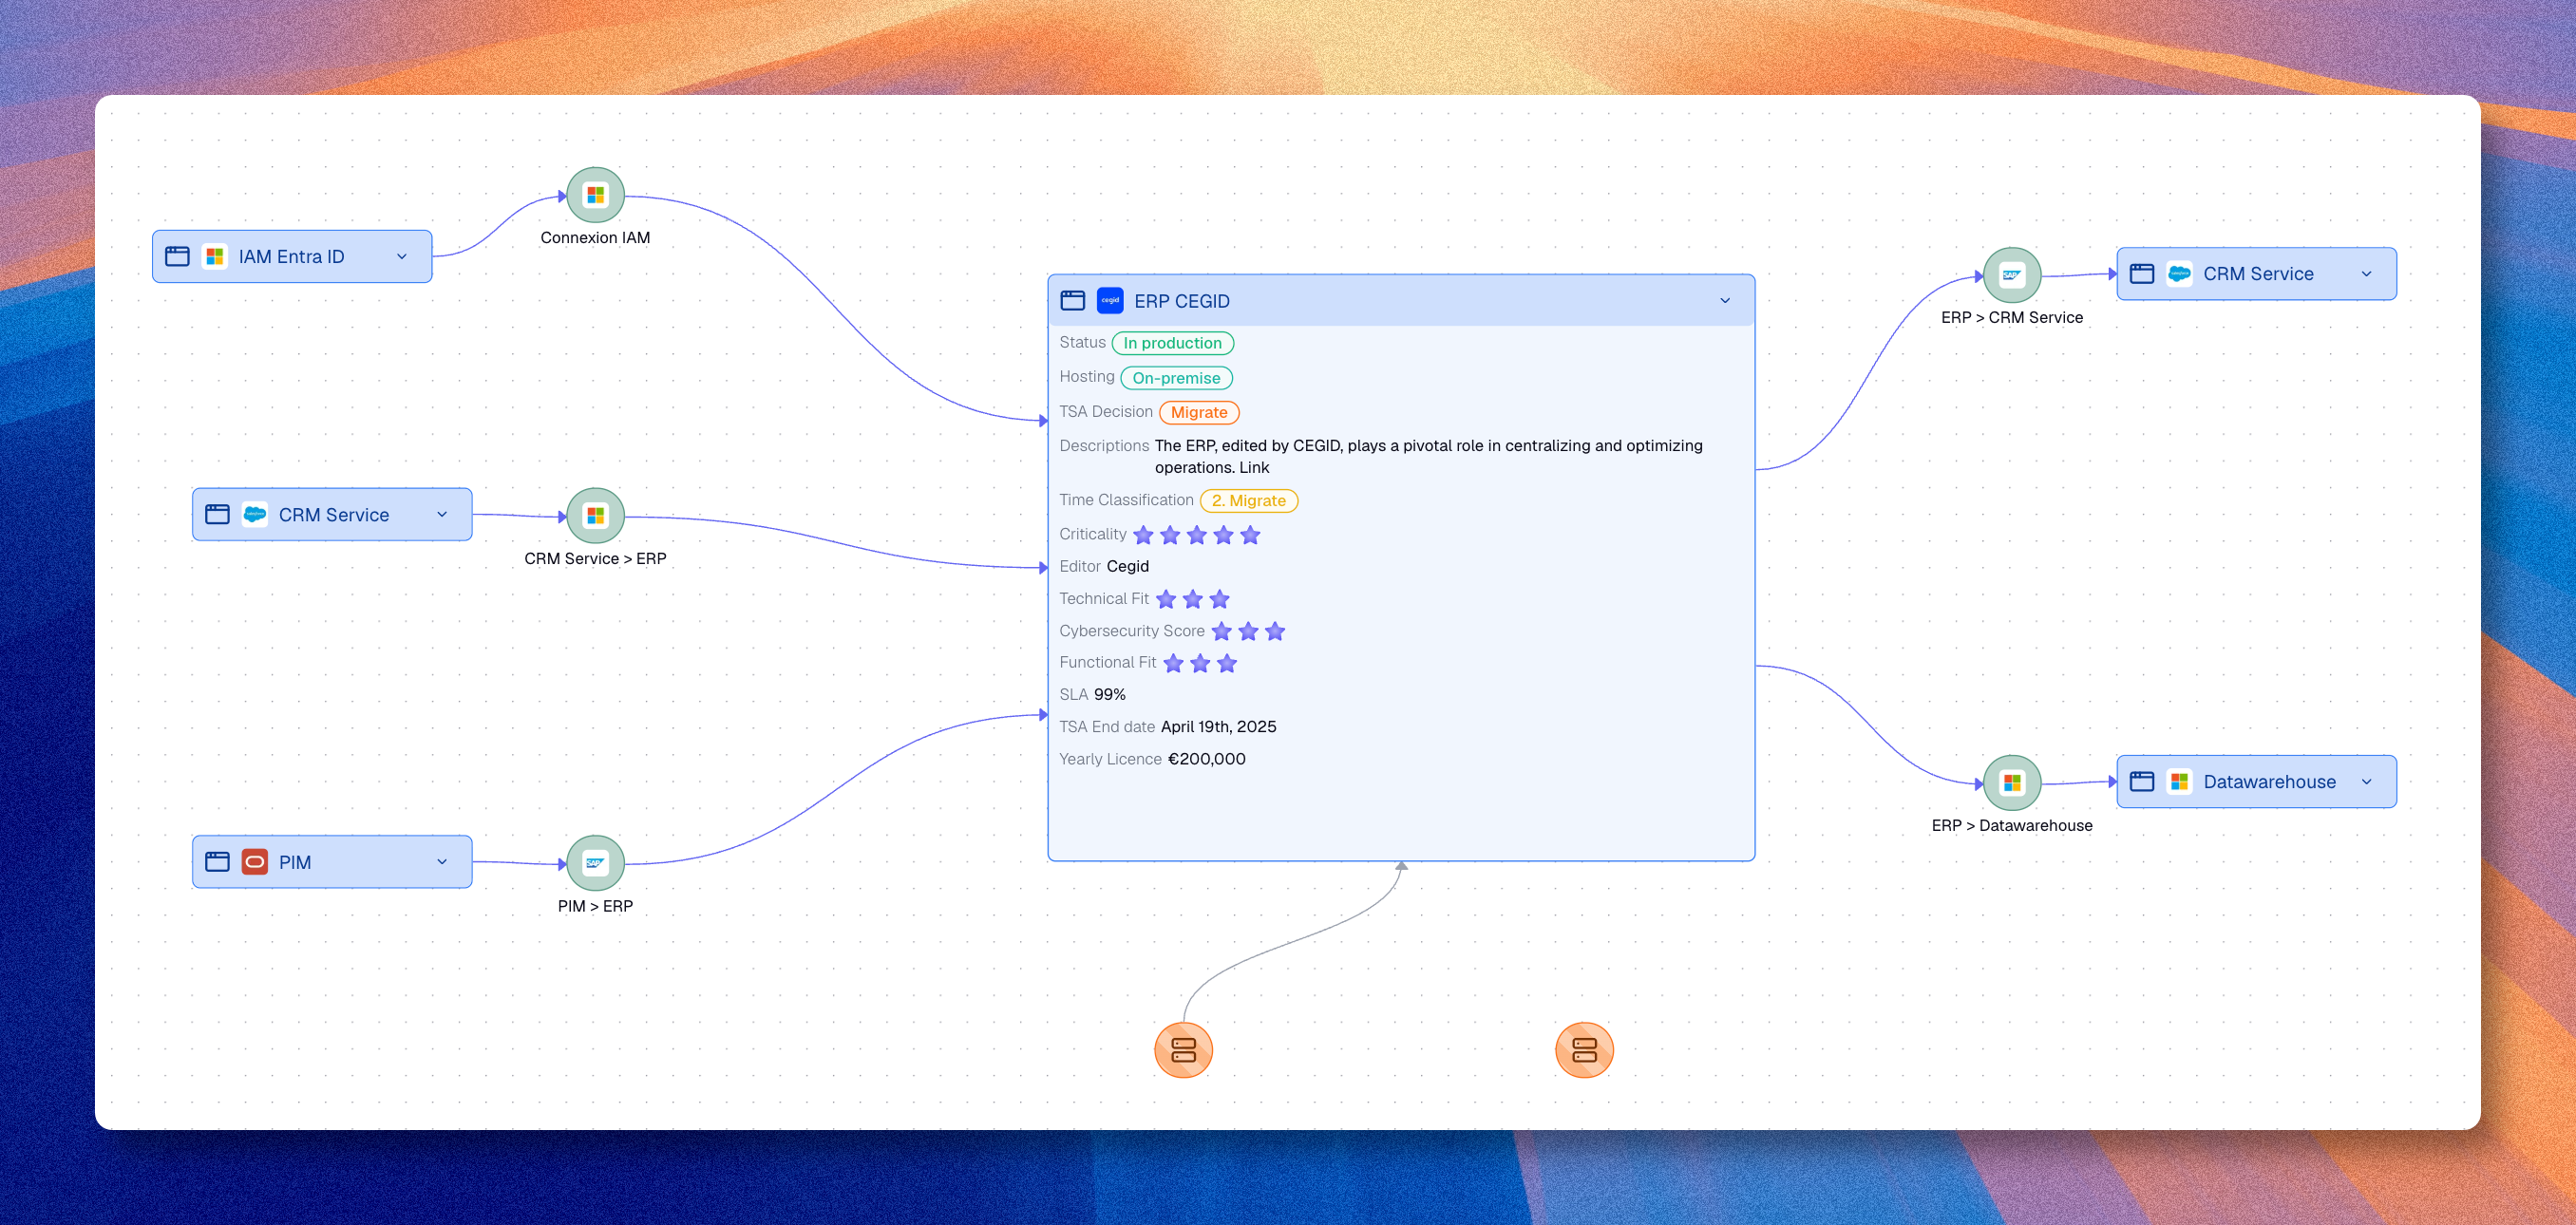
Add related assets
To grow the diagram from an existing node:
- Select an asset on the canvas
- Use one of these two methods:
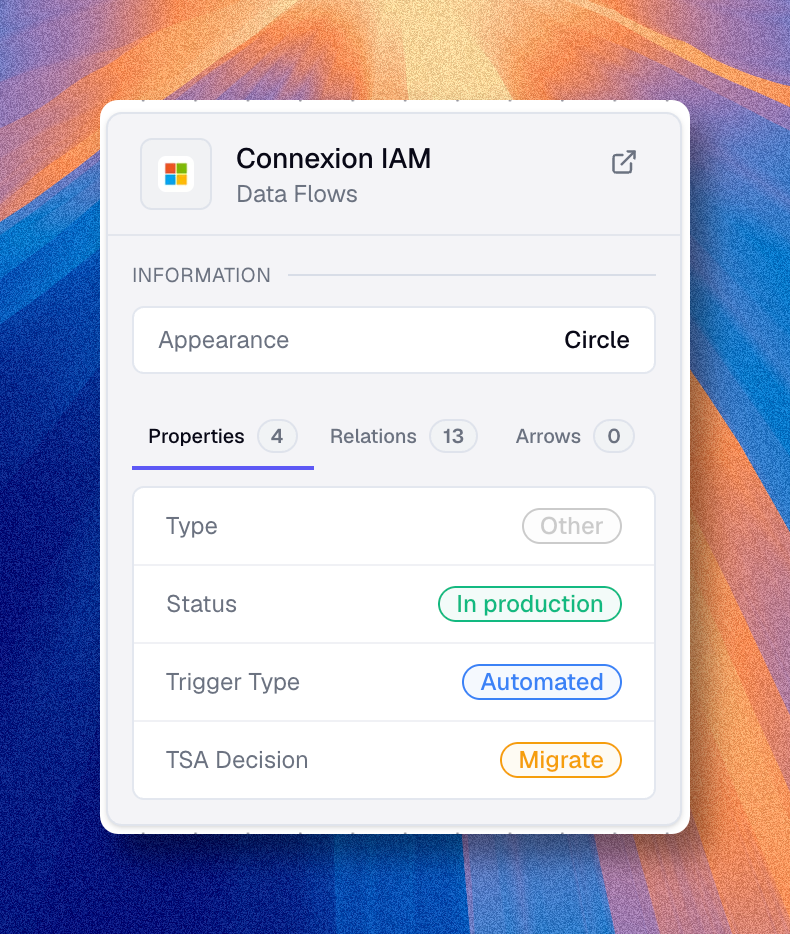
- Use the related assets action to display linked assets directly from the node
- Or open the floating detail panel, open the Relations tab, and click the related assets you want to display in the diagram
This is one of the fastest ways to build a meaningful diagram while staying aligned with the inventory.
Connect and enrich the diagram
Create visual or real relationships
When you draw a connection between two nodes, Boldo first creates a visual arrow in the diagram.
You can then use the field that appears on the connection in two different ways:
- Type a name and keep it as a visual arrow used only in the diagram
- Choose one of the compatible relationship types proposed in the menu
If you choose a relationship type between two existing inventory assets, Boldo checks whether that relationship already exists between them.
- If it already exists, the edge becomes linked to that existing inventory relationship
- If it does not exist yet and you have the right to create it, Boldo creates it in the inventory and links the edge to it
- If Boldo cannot create that relationship, the edge stays a visual arrow in the diagram
If one of the nodes is still a draft node, or if you connect an asset to itself, the connection stays a visual arrow even if you pick a relationship name.
Add shapes, text, and images
Use these elements to explain the diagram without modifying the source data itself.
They are useful for:
- annotations
- titles
- decision notes
- workshop framing
Use groups and lanes
Use groups and lanes when you want visual structure on top of the asset graph.
Examples:
- one lane per domain
- one group per project
- one section for current state and one for target state
To remove a group container without deleting its contents, right-click the group and choose Dissolve group. To detach a group from its parent group, choose Ungroup.
Layout and navigation
You can refine the diagram manually with:
- alignment tools
- distribution tools
- display order
- grouping
- lanes
You can also rely on:
- cameras to save viewpoints
- search to find an element quickly
- list panels to inspect all nodes in the diagram
You can also reorganize a diagram automatically when you want a cleaner starting layout. This works on the whole diagram, or only on the selected nodes when you want to rearrange one part without moving everything else.
A good diagram
A good diagram does not try to show everything.
It should let a reader quickly understand:
- the selected scope
- the important relationships
- the message or decision the diagram supports
Real-time collaboration
Multiple users can edit a diagram at the same time.
That makes diagrams especially useful for:
- workshops
- review sessions
- collaborative modeling
Typical collaboration signals include:
- presence indicators
- live selections
- synchronized updates
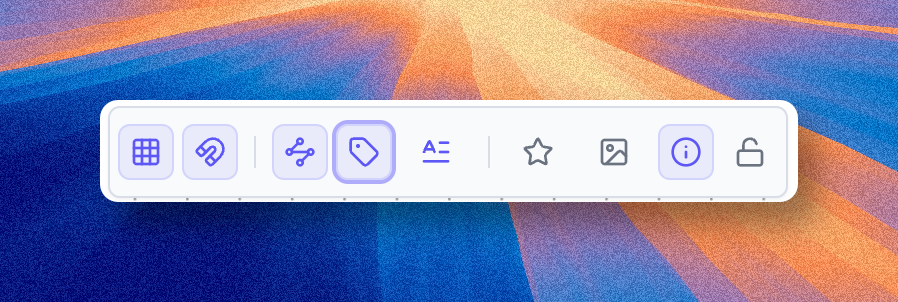
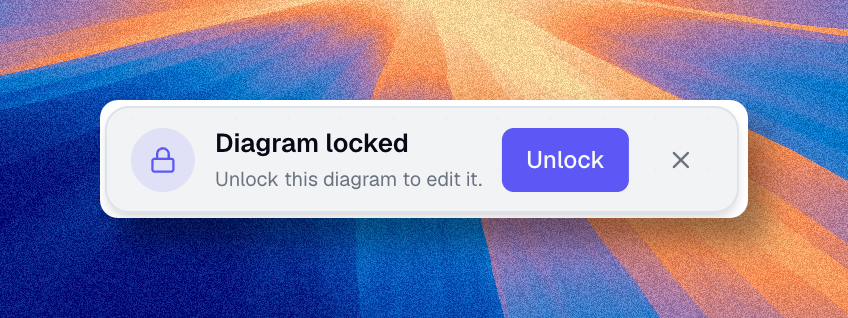
Lock a diagram
You can lock a diagram to prevent accidental edits. Use the lock toggle in the canvas settings panel. When a diagram is locked, an overlay blocks editing until you unlock it. This is useful when presenting or reviewing a finished diagram.
Export
Diagrams support PNG export.
Use the main download action when you want to export the whole diagram as one image.
If you use cameras, you can also export a PNG from a specific camera.
In that case, Boldo exports only the part of the diagram that falls inside that camera frame. This is useful when one large diagram contains several areas that you want to share separately.