Nested maps
Nested maps display assets as hierarchical blocks computed from relationships in the inventory.
Use them when you want to reveal containment, hierarchy, or dependency paths that already exist in the knowledge base.
Use a nested map when the hierarchy itself is the message. If the goal is freeform explanation or workshop discussion, a diagram is usually better.
Principle
A nested map organizes assets in successive levels, each level being visually contained in the previous one.
Typical example:
Business Capability
└── Functional Domain
    └── Process
        └── Application
Unlike a manually drawn hierarchy, a nested map is generated from rules:
- which root asset type to start from
- which relationships to follow
- in which direction to traverse them
- which filters to apply at each step
That means the quality of the result depends mostly on the quality of the relationships in the inventory.
The direction of each traversal changes what the map actually shows. Reading a relation outgoing from an application reveals what it depends on. Reading the same relation incoming reveals what depends on it. The same structure can therefore be used to trace a chain of dependencies from either end.
Access
- Click "Nested Maps" in the navigation
- The catalog displays on the left
- Select an existing map or create a new one
Create a nested map
- Click "+" in the catalog
- Select "New nested map"
- Configure the root and traversal rules
- Name and save
Configuration
Root asset type
Select the asset type that will act as the top level of the map.
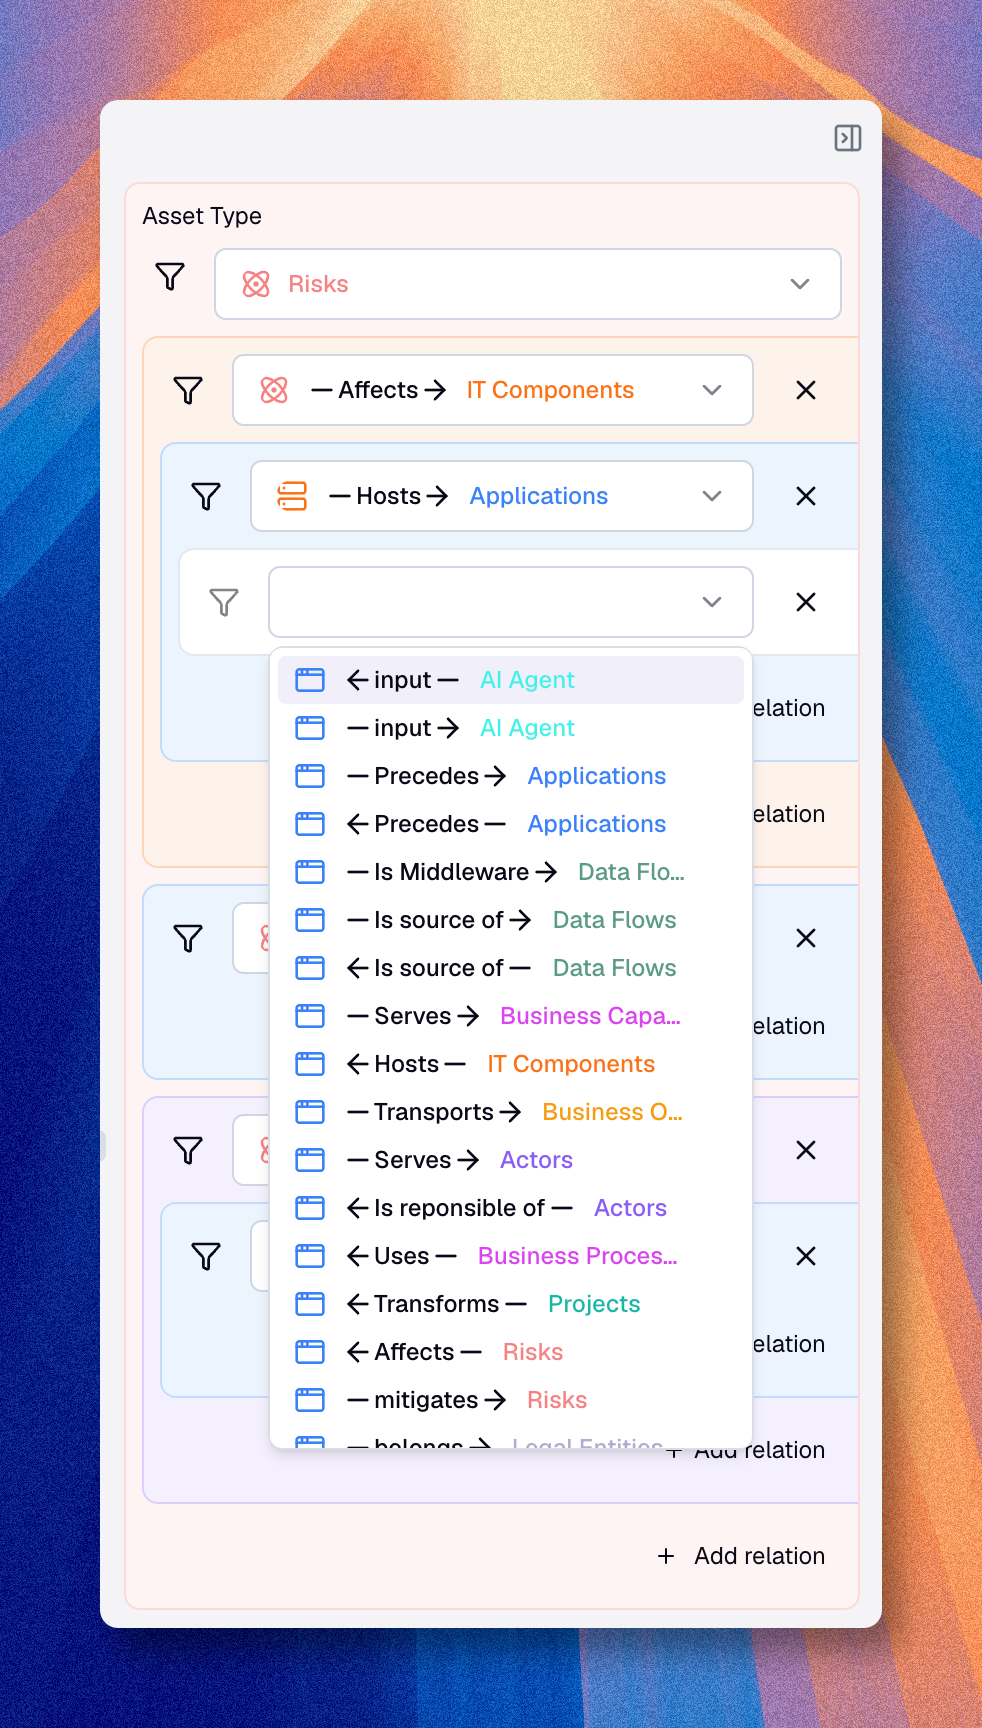
Traversal rules
Traversal rules tell Boldo how to move from one level to the next.
For each level, define:
- the target asset type
- the relationship to follow
- the direction to use
Parallel branches
A level can carry more than one traversal rule. You can combine several relations at the same level, for example to show under each process both the applications that support it and the teams that own it. Each branch is configured independently, with its own target type, direction, filters, and highlight.
This turns the map into a compact way to read several aspects of the same asset side by side, rather than forcing a single linear chain.
Hidden levels
An intermediate level can be hidden. The level is still used to compute the traversal, but it is not rendered in the final map. Use this when a connector entity is needed to bridge two assets in the metamodel but adds no meaning to the reader.
Filters
You can apply filters at every level of the map.
See Filters for the full list of operators, filter targets, and how to combine conditions with groups.
What nested maps are best for
Nested maps are especially useful when your data already forms a meaningful hierarchy, for example:
- capability to process to application
- domain to sub-domain to application
- zone to sub-zone to component
- organization to team to responsibility
They are less useful when the relationships do not form a stable hierarchy.
Because the direction of each traversal is configurable, the same relationships can also be read the other way around. Starting from an application, for instance, you can drill back up to the processes and capabilities it supports. This makes nested maps a practical way to see which assets sit under a given one, and which ones would be reached if that asset changed or failed.
Combined with highlighting on a property like status, criticality, or maturity, the chain reveals not only what is connected, but where attention is needed along the path.
Display modes
Nested maps offer two views and a distribution option, all accessible from the toolbar.
Nested view
The nested view shows the hierarchy as blocks visually contained inside their parent blocks. This is the default mode. It works best for small to medium hierarchies where the nesting itself carries meaning. At each level, child blocks are distributed across columns based on the available width.
List view
The list view shows the same hierarchy as a flat, indented list with a colored bar on the left of each level. Each level uses a distinct color. This mode is more compact and easier to scan when the hierarchy has many items or deep nesting.
Balanced distribution
Use the balanced distribution toggle in the toolbar to change how blocks are arranged across columns. This option works with both the nested and list views.
When active, Boldo sorts blocks by weight - elements with the most children appear first - and places each block in the shortest column. This keeps the map visually balanced by preventing one column from becoming much taller than the others.
When inactive, blocks are distributed across columns in their original order.
Balanced distribution is useful when root-level blocks vary widely in size. It places the most complex structures where they are easiest to read.
Clicking a block
Click any asset block to open a preview panel on the right. The panel shows the asset's details without leaving the map. Click the block again or press Escape to close the panel.
Highlight by property
You can highlight blocks using values from a specific property. Highlighting can be configured on the root asset type and independently on each traversal level. Each distinct value appears as a colored tag on the block.
Boldo can generate colors automatically with an auto-palette, or you can assign colors manually to specific values. Highlighting can be configured independently at each traversal level.
This is useful when you want to add a second reading dimension to the map, for example: highlight applications by their status, or capabilities by their maturity level.
Use cases
| Need | Configuration |
|---|---|
| Capability mapping | Capabilities → Domains → Applications |
| Organizational view | Departments → Teams → Responsibilities |
| Technical architecture | Zones → Sub-zones → Components |
| Value chain | Macro-processes → Processes → Activities |
| Reverse reading | Application ← Processes ← Capabilities |
Export
Use the download action when you need the map as an image. The exported file is an image.
Best practices
- limit the number of levels for readability
- filter the roots when the top level is too large
- use relationships that make business sense
- pick the direction that matches the question you are asking
- hide intermediate levels that only exist to connect two meaningful ones
- use highlighting to add a second reading dimension
- switch to list view when nesting gets too deep to read comfortably
- use balanced distribution when the root level has many items